
Simplifying Physiological Assessments
Instead of relying on fixed zones or single metrics, assess.works analyzes the dynamics of physiological signals — how oxygenation changes, how recovery behaves, where compensation appears, and which system becomes limiting. Built on the principle that physiology is a continuous system rather than isolated numbers, it merges and compares data from different tests to deliver clearer insight and faster, more confident decisions.
Core Tools That Replace the Spreadsheet Chaos
Assess.Works is a platform built specifically for physiological assessments. It replaces the Excel-based hacks and manual workflows many coaches rely on, making lab testing feel simple instead of a data science project. No more digging through raw files or juggling spreadsheets to create makeshift charts – it streamlines the whole process for you. The result is precise, actionable insights without all the hassle.
Not all assessment tools are built equally —and not all professionals use them the same way. Today’s performance diagnostics space is split into three camps.
First, there are the labs and medical centers that rely on “push-button” tests like VO2max, often accepting whatever results the machine outputs—ignoring valuable physiological signals beyond the basics. Then there are advanced experts that can use the same as first group who export test data into Excel or Google Sheets, building custom graphs and calculations by hand. It’s powerful but painfully slow. Finally, there’s the group that uses expensive sensors—but still relies on outdated shortcuts, like max heart rate formulas or Conconi-style estimates, which often don’t hold up across individuals. We could even mention a fourth group: those who use just one signal—like lactate—and try to magically estimate five zones and every physiological detail from it. But that level of oversimplification is completely out of scope for this platform.
This tool is built first and foremost for the second group—those who seek real insight but need speed and clarity to scale their work. At the same time, it shows the other groups a better path forward. We automate the busywork so experts can focus on what matters: identifying strengths, spotting weaknesses, and knowing what to do next. For the first and third groups, Assess.Works offers a more complete approach—one that connects all your biosignals into a coherent, actionable story.
We don’t promise magic answers. Instead, it accelerates the discovery process. Our tools help you analyze more tests, detect the real limiters, and deliver smarter decisions. The mission? Make assessments better, faster, and scalable—without compromising depth.
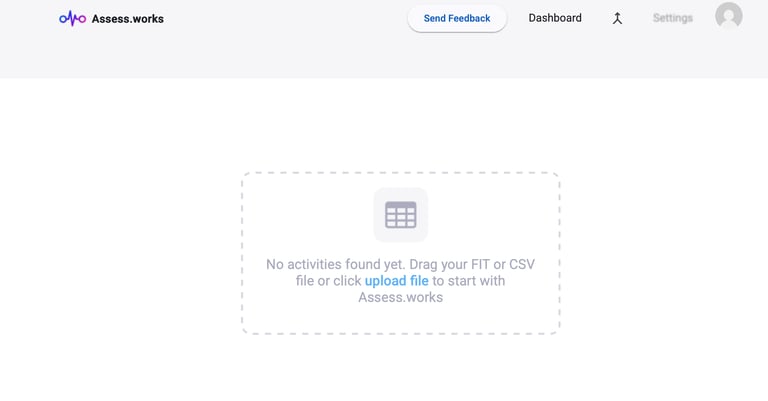
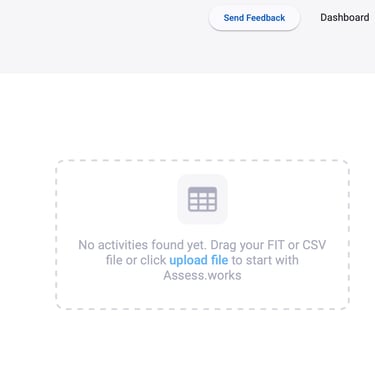
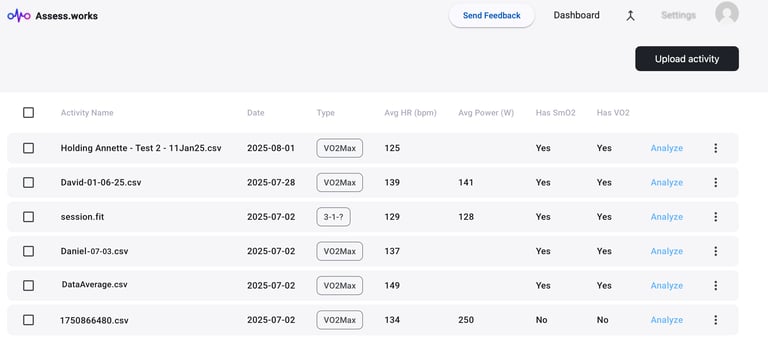
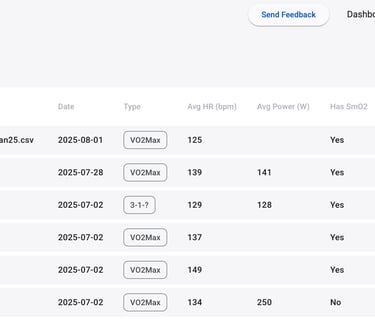
Skip the file-format headaches. You can upload your data in seconds from common formats like CSV or Excel (for example, COSMED exports) and even proprietary files like Train.Red or Moxy monitor. We supports them all, so you don’t waste time converting files or cleaning up data.
Simple File Import
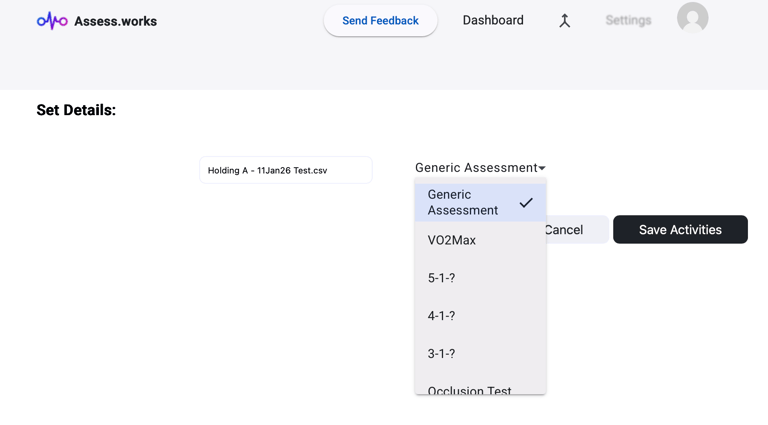
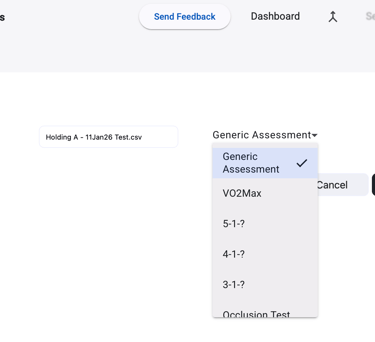
Assigning activity type keeps your assessments organized by type for easy comparison. You can tag each activity (e.g. VO2 max test, lactate step test, etc.) so that similar tests are grouped together. This makes it simple to compare like-for-like over time and see how an athlete progresses under the same conditions.Write your text here...
When you import a file, Assess.Works automatically creates activity entries based on the content. The platform reads your test data and breaks it into the right segments for you. This means no more manual setup – your sessions are ready to analyze as soon as you upload.
Activity
Each activity is the backbone of your analysis. It holds everything—from imported files and field mappings to calculated zones, saved charts, and more.
Standardized field names ensure consistency across sessions, while default configurations make charts instantly usable. Powered by intelligent automation, pre-processesing your data to identify structure, detect patterns, and surface key insights. Whether you're working with VO2, SmO2, or substrate data, each activity keeps your workflow organized so you can focus on insight—not setup.
Assess.Works gives you more than just pretty graphs—it delivers a true visual analysis engine, built specifically for physiological data. Our custom rendering system handles heavy datasets effortlessly, letting you pan, zoom, and explore in real-time.
Smarter Charts. Deeper Insights.
Experience smooth, flexible charting that typical spreadsheet tools or basic apps can’t match. The system uses a custom-built rendering engine designed for heavy physiological data. In practice, this means you can plot complex datasets with multiple metrics and still pan, zoom, and adjust everything in real-time. The charts stay responsive no matter how much data you throw in, so you never feel limited by the tool.
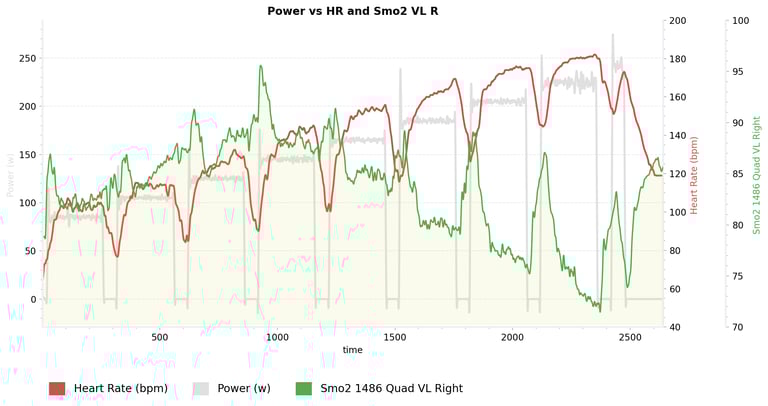
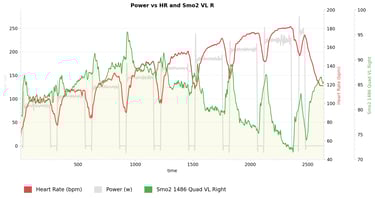
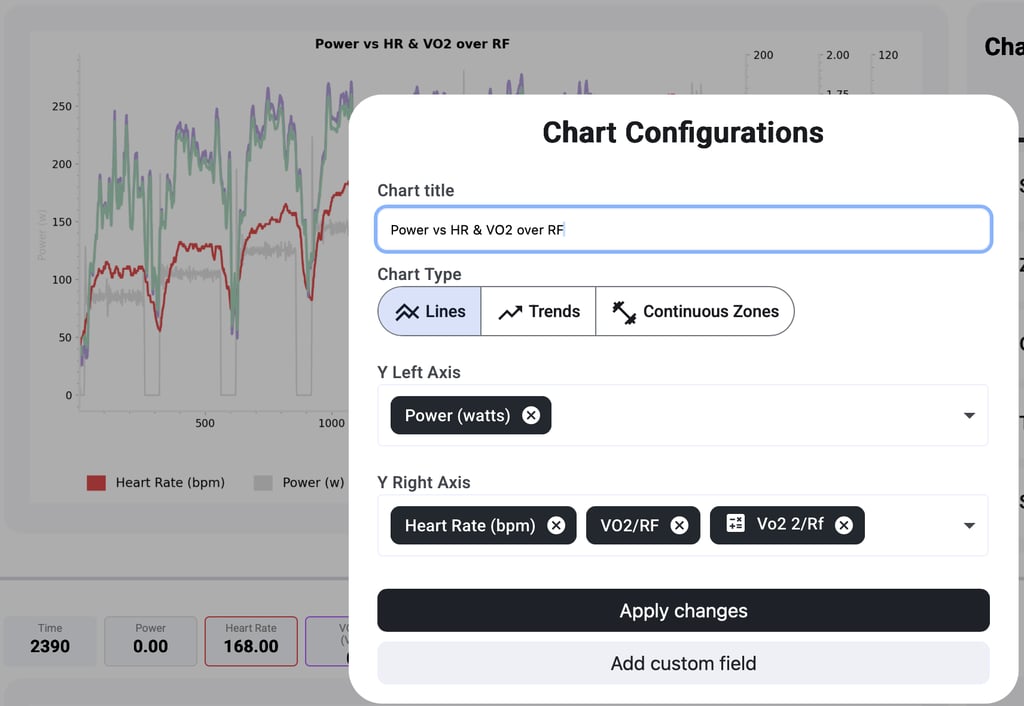
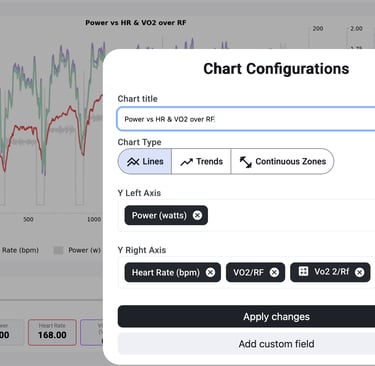
Want to see how multiple metrics interact? Use up to four Y-axes to overlay heart rate, power, oxygen saturation, and more on a single chart. With intelligent preprocessing and unsupervised clustering running in the background, it highlights patterns that might otherwise stay hidden. It’s not just visualization—it’s insight, powered by automation.
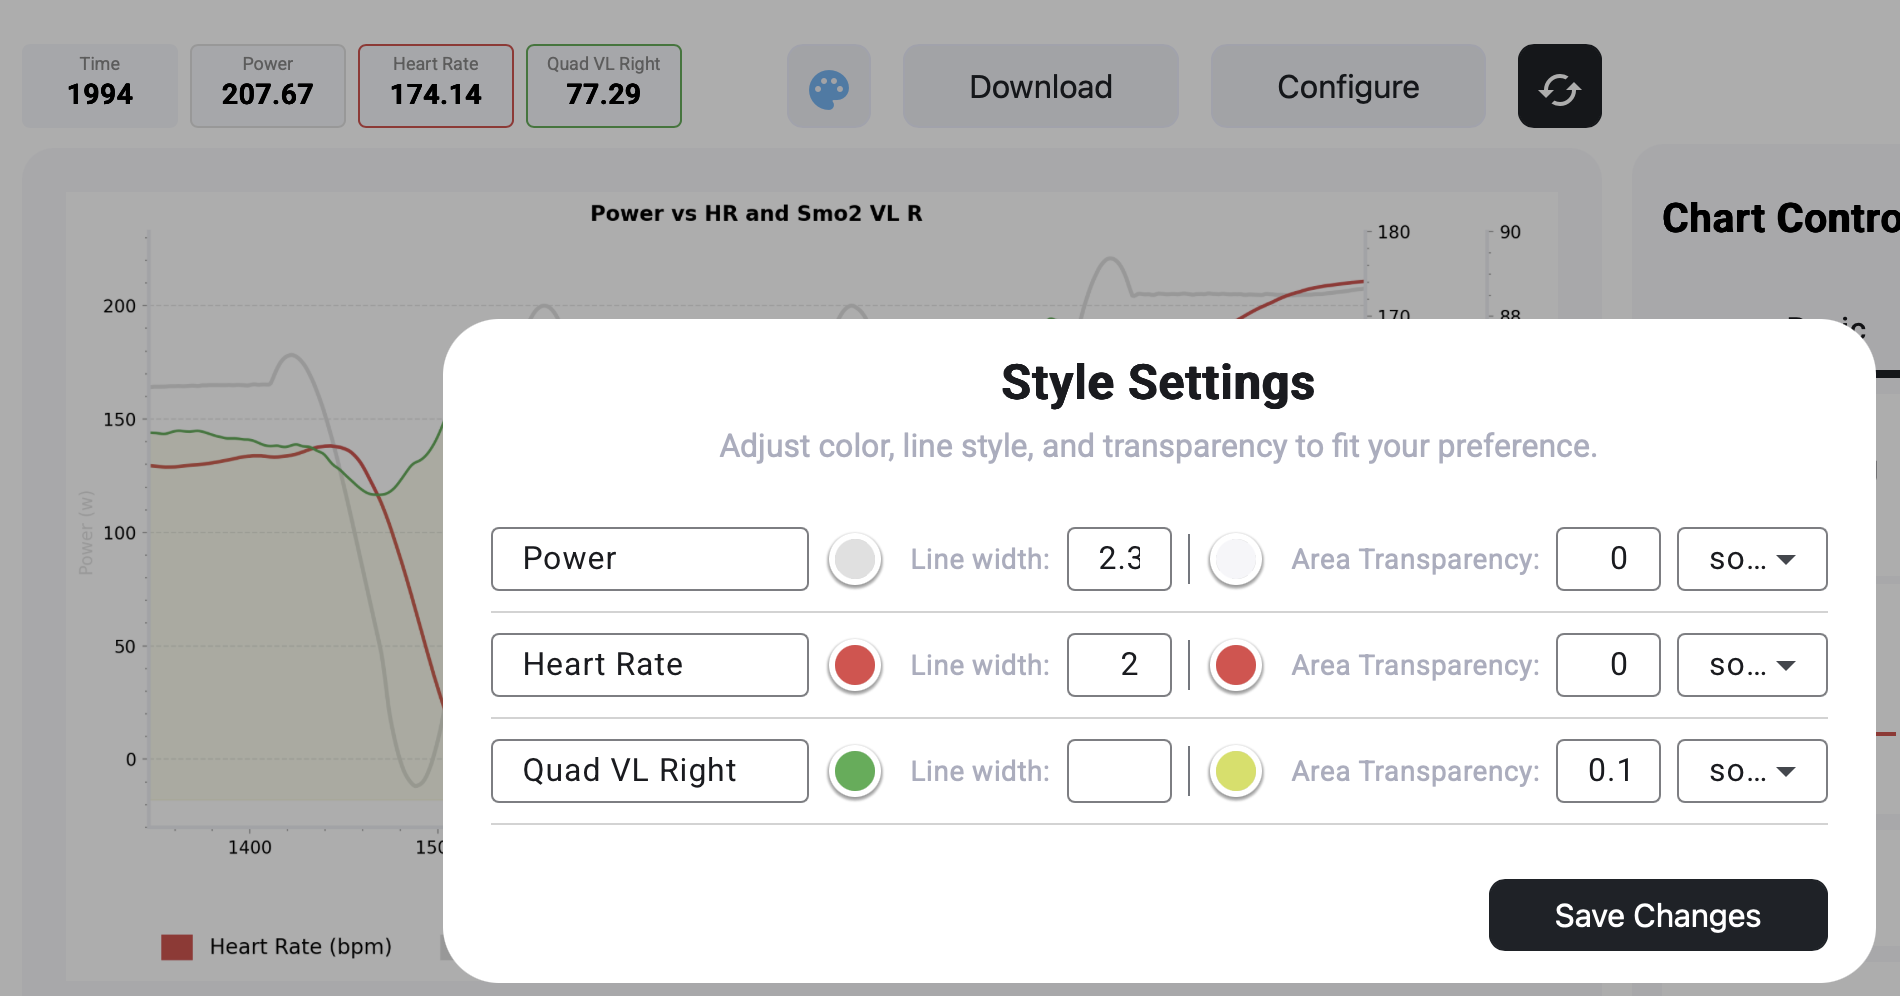
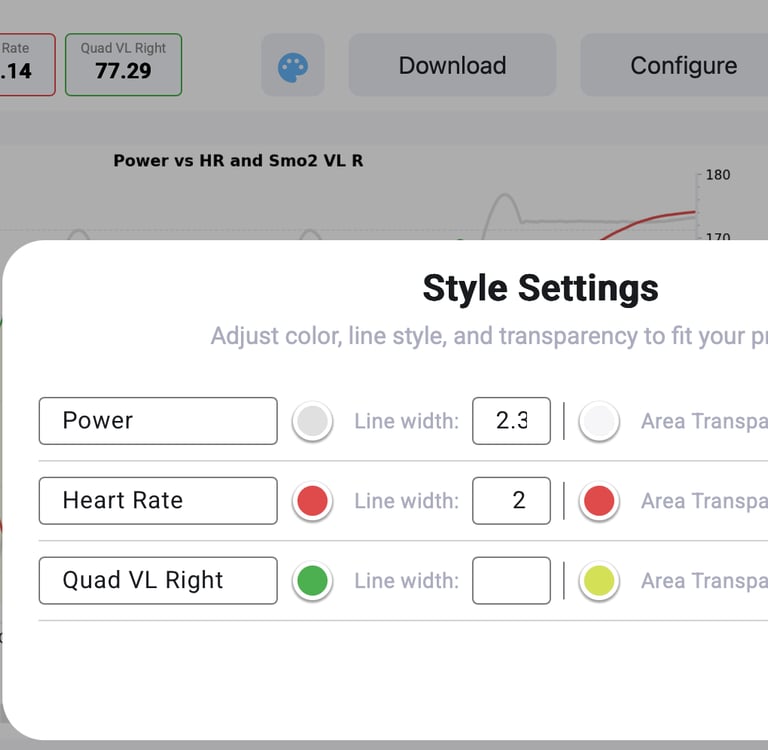
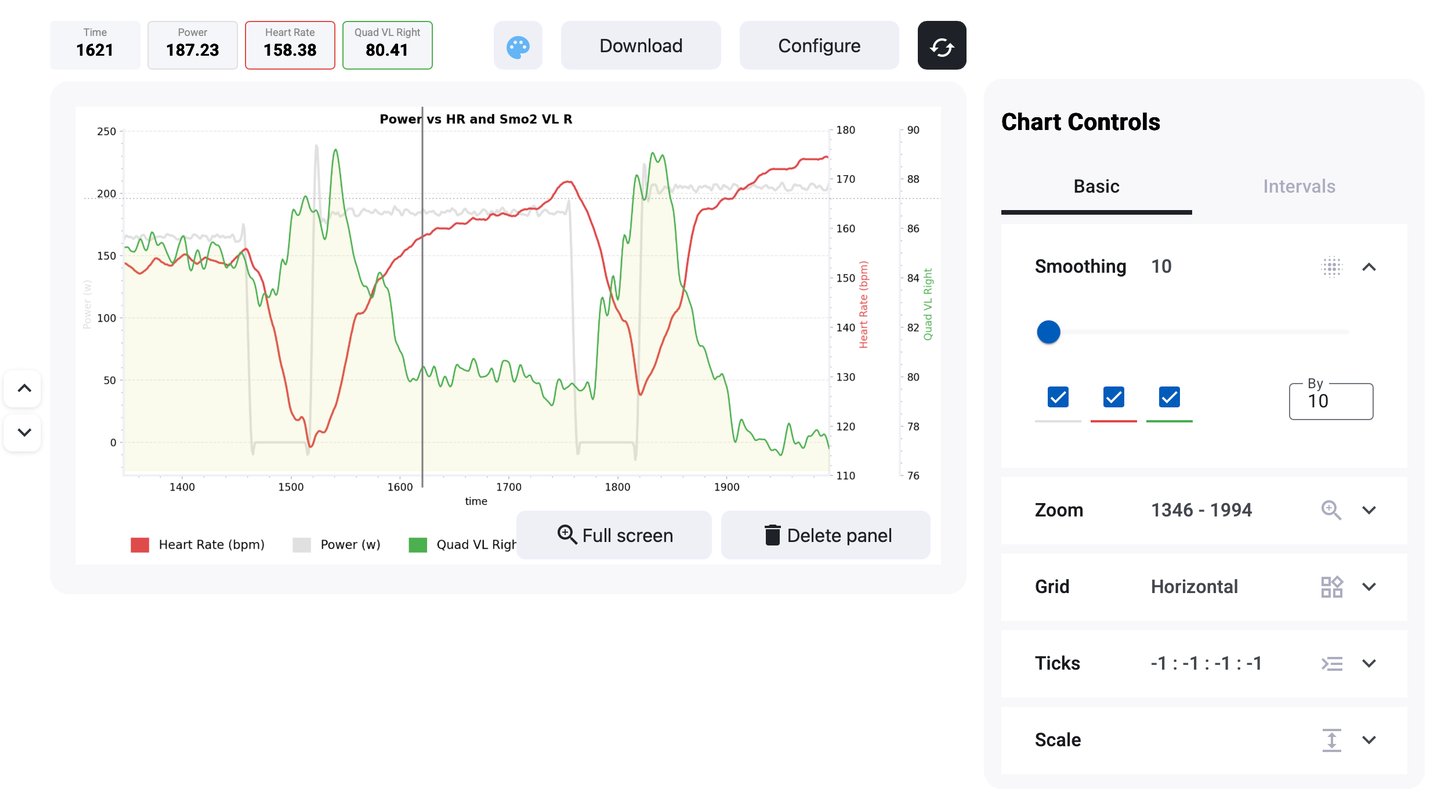
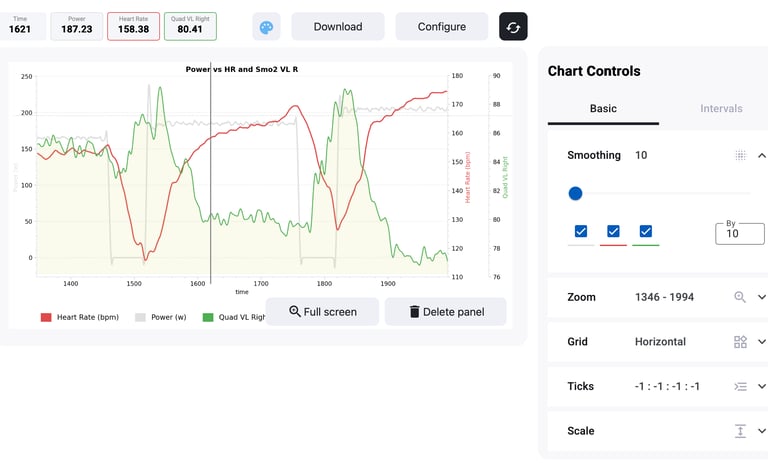
You control how your charts look and feel. Smooth noisy curves, choose line colors, toggle gridlines, and scale axes to emphasize key details. Customize your view to highlight what matters—then save those views for repeat tests. It’s your data, your way.
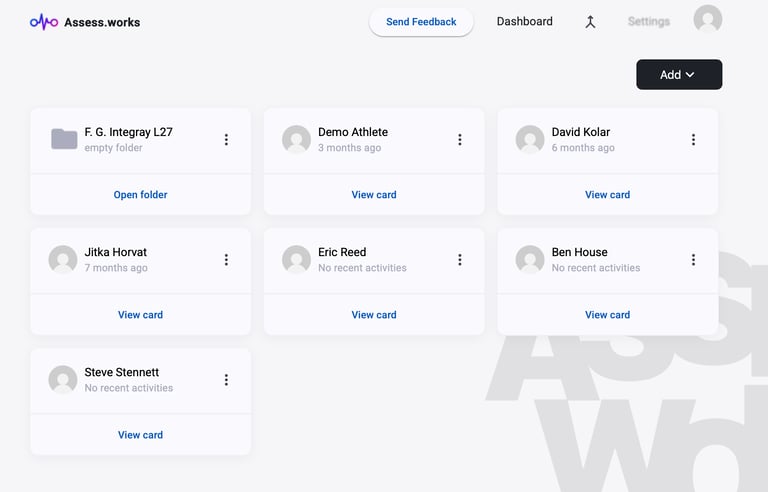
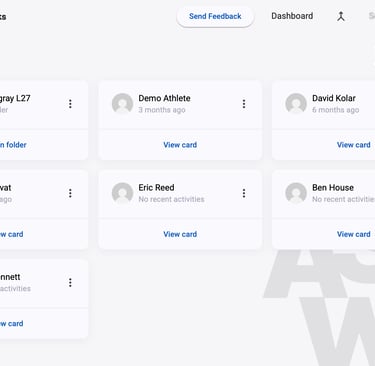
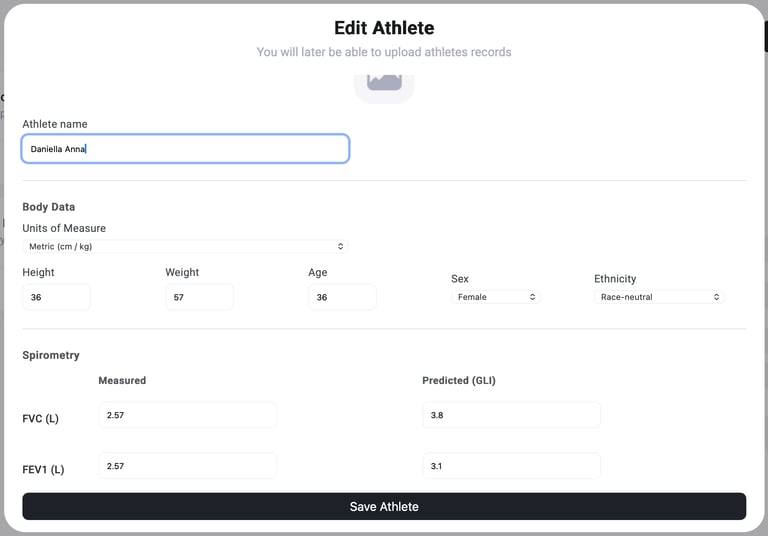
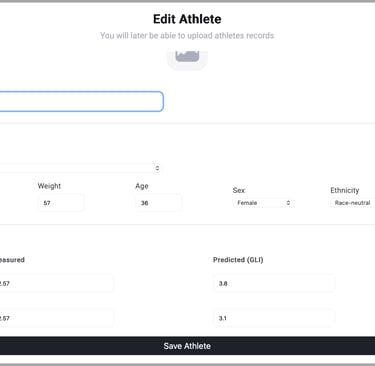
Organized Athlete Profiles
Keep all your athlete data organized and accessible. lets you create athlete folders with profile info for each person. In one place, you can store an athlete’s key details – including spirometry results (lung function) - All of that athlete’s past tests and charts live in their folder too, so you can quickly review history or compare performances without digging through files.
Each of these core features is designed to replace cumbersome manual work with a smoother, smarter workflow. Assess.Works takes care of the heavy lifting – from data import to advanced visualization – so you can focus on interpreting results and coaching your athletes.
Ready to explore more? In the next sections, we’ll dive into the advanced tools that make assess.works even more powerful, like trendlines, interval breakdowns, clustering analysis, and other insights that take your assessment to the next level. Keep reading to see how these features can further enhance your performance analysis experience.
© 2025. All rights reserved.
Resources
Blog
Support
Company
Performance efficiency
Efficiency Metrics
Onboarding Call Booking